I started off by making a data visualisation showing the proportion of all of the different cuisines in Brighton using data from Trip Advisor.
Apparently the cuisine with the most restaurants in Brighton is British cuisine, which is probably including pubs as there are a lot of pubs in Brighton!
Showing posts with label data visualisation. Show all posts
Showing posts with label data visualisation. Show all posts
Thursday

Tuesday
Further to my previous data visualisation I have made an improved version using Adobe Photoshop, using flags to represent each cuisine.
In the case of a few categories that aren't representative of cuisine from any specific country, such as Middle Eastern, Asian, Vegetarian and Seafood, I picked one flag to represent that category, or a fitting image in the case of Vegetarian and Seafood.


Thursday


Friday
Venngage data visualisation
I've recently discovered this site called Venngage that lets you create your own data visualisations and graphs, either by using an already made template or by starting completely from scratch and making your own thing.
I decided to use my Brighton restaurant data from Tripadvisor and made a page of data visualisations from scratch. I'm not able to embed the html of the page in this post but you can access it HERE.
I've included a screen grab of the graph so you can see what it looks like but without the interactive part which is quite important to the understanding of the data.

The pie chart is interactive; when you hover over each coloured slice it tells you what type of cuisine it is representing and how many restaurants of that cuisine there are in Brighton.
UPDATE: unfortunately I discovered when recently testing out the link that Venggage has made some changes to my infographic and the pie chart no longer gives you the names of the different cuisines when you hover over each section. Instead I've added in a box underneath the pie chart to explain the colour coding, and when you hover over each different cuisine type in the box it should light up the section for that cuisine in the pie chart, making it easier for you to see which slice refers to which cuisine.
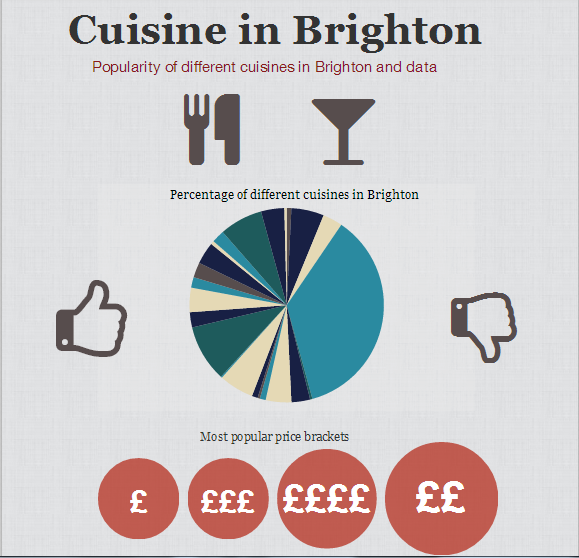
The '£' bubbles represent the different price brackets in relation to Brighton restaurants, and what percentage of restaurants fall under each price bracket. So, for example, most restaurants in Brighton are moderately cheap (represented by '££') and very expensive restaurants come in second (represented by '££££').

At the bottom of the page I've made a wordcloud consisting of the most popular dining options available for Brighton restaurants.
Please click on the link, or the first image, to be taken to the real graph so you can get a proper feel of it.
Wednesday
Stefanie Posavec
I was trying to find more data I could take from Tripadvisor, as there's only a limited amount of data that's immediately available, such as the number of restaurants of each cuisine and the number of restaurants in each price bracket.
I wanted to try and work out the hierarchy of rankings of each different cuisine in Brighton, but the only way to do that was to go through the incredibly long process of noting down the ranking of every restaurant in each category of cuisine (such as #1, 6, 9 etc...)
I did this for all of the restaurants that came under the category British cuisine, and ended up with a very long list of numbers that didn't really mean anything, realising that it would take way too long to do the same for each of the different cuisine types in Brighton...
1, 3, 4, 6, 7, 25, 29, 32, 37, 42, 51, 52, 54, 57, 60, 65, 67, 77, 84, 90, 91, 96, 97, 98, 100, 102, 104, 105, 108, 110, 111, 113, 115, 116, 118, 119, 128, 133, 137, 140, 105, 108, 110, 111, 113, 115, 116, 118, 119, 128, 133, 137, 140, 142, 146, 148, 149, 150, 153, 154, 156, 158, 160, 163, 165, 169, 173, 175, 178, 201, 204, 209, 211, 214, 218, 219, 220, 222, 232, 233, 234, 235, 238, 243, 245, 246, 247, 254, 261, 264, 272, 281, 286, 289, 290, 291, 292, 293, 296, 301, 304, 307, 311, 316, 317, 318, 322, 326, 337, 343, 344, 347, 350, 351, 354, 356, 362, 370, 374, 377, 378, 382, 388, 389, 391, 392, 396, 399, 400, 402, 404, 407, 409, 412, 414, 415, 420, 423, 427, 428, 431, 433, 435, 436, 453, 459, 460, 461, 465, 475, 476, 478, 480, 484, 488, 492, 494, 498, 503, 508, 511, 512, 516, 518, 523, 524, 525, 526, 530, 533, 538, 548, 556, 558, 559, 565, 566, 570, 572, 578, 584, 585, 586, 587, 592, 593, 596, 604, 612, 617, 623
When I showed this long sequence of numbers to my tutor Andrew he thought it was actually interesting and worth including in my project.
I thought this was kind of relatable to the work of artist/data visualiser Stefanie Posavec, who does these amazing hand written data visualisations that are basically a load of data - letters/words and numbers - arranged in such a way as to create what can be seen as a piece of art.
She simply uses a set of highlighters and a ballpoint pen, colour coding data to create patterns and innovative data visualisations...


I wanted to try and work out the hierarchy of rankings of each different cuisine in Brighton, but the only way to do that was to go through the incredibly long process of noting down the ranking of every restaurant in each category of cuisine (such as #1, 6, 9 etc...)
I did this for all of the restaurants that came under the category British cuisine, and ended up with a very long list of numbers that didn't really mean anything, realising that it would take way too long to do the same for each of the different cuisine types in Brighton...
1, 3, 4, 6, 7, 25, 29, 32, 37, 42, 51, 52, 54, 57, 60, 65, 67, 77, 84, 90, 91, 96, 97, 98, 100, 102, 104, 105, 108, 110, 111, 113, 115, 116, 118, 119, 128, 133, 137, 140, 105, 108, 110, 111, 113, 115, 116, 118, 119, 128, 133, 137, 140, 142, 146, 148, 149, 150, 153, 154, 156, 158, 160, 163, 165, 169, 173, 175, 178, 201, 204, 209, 211, 214, 218, 219, 220, 222, 232, 233, 234, 235, 238, 243, 245, 246, 247, 254, 261, 264, 272, 281, 286, 289, 290, 291, 292, 293, 296, 301, 304, 307, 311, 316, 317, 318, 322, 326, 337, 343, 344, 347, 350, 351, 354, 356, 362, 370, 374, 377, 378, 382, 388, 389, 391, 392, 396, 399, 400, 402, 404, 407, 409, 412, 414, 415, 420, 423, 427, 428, 431, 433, 435, 436, 453, 459, 460, 461, 465, 475, 476, 478, 480, 484, 488, 492, 494, 498, 503, 508, 511, 512, 516, 518, 523, 524, 525, 526, 530, 533, 538, 548, 556, 558, 559, 565, 566, 570, 572, 578, 584, 585, 586, 587, 592, 593, 596, 604, 612, 617, 623
When I showed this long sequence of numbers to my tutor Andrew he thought it was actually interesting and worth including in my project.
I thought this was kind of relatable to the work of artist/data visualiser Stefanie Posavec, who does these amazing hand written data visualisations that are basically a load of data - letters/words and numbers - arranged in such a way as to create what can be seen as a piece of art.
She simply uses a set of highlighters and a ballpoint pen, colour coding data to create patterns and innovative data visualisations...
She's made a data visualisation of Jack Kerouac's On The Road, dividing the book up into chapters, paragraphs and sentences.
When you look at the overall image you can't tell that it's made up of words and data, or that it's handwritten and not digitally generated.
Subscribe to:
Posts (Atom)