Friday

Foreword

This project is about cuisine in Brighton, or rather all of the data around that cuisine. I've found it interesting seeing how much data can be gathered around the subject, and what can be done with this data, including all of the different ways it can be displayed.
I've also found it particularly interesting looking at the communities around cuisine in Brighton; Tripadvisor, especially, has a large community, including some people who are particularly involved and contribute regularly, often giving away personal information about themselves in their reviews.
It's a little bit scary just how much information about themselves some of these people give away probably without even realising; I've had fun seeing what I could do with this information and data!


NB. the data I've used is taken at one specific moment in time and is therefore subject to change.


Thursday

I started off by making a data visualisation showing the proportion of all of the different cuisines in Brighton using data from Trip Advisor.
Apparently the cuisine with the most restaurants in Brighton is British cuisine, which is probably including pubs as there are a lot of pubs in Brighton!


undefinedAfrican: 4AfricanAmerican: 28AmericanAsian: 17AsianBritish: 187BritishCaribbean: 2CaribbeanChinese: 16ChineseFrench: 22FrenchFusion: 5FusionGerman: 2GermanGreek: 5GreekIndian: 30IndianIrish: 1IrishItalian: 49ItalianJapanese: 13JapaneseMediterranean: 21MediterraneanMexican: 9MexicanMiddle Eastern: 13Middle EasternSeafood: 19SeafoodSouth American: 3South AmericanSpanish: 11SpanishThai: 37ThaiVegetarian: 20VegetarianVietnamese: 2Vietnamese

Tuesday

Further to my previous data visualisation I have made an improved version using Adobe Photoshop, using flags to represent each cuisine.
In the case of a few categories that aren't representative of cuisine from any specific country, such as Middle Eastern, Asian, Vegetarian and Seafood, I picked one flag to represent that category, or a fitting image in the case of Vegetarian and Seafood.


Thursday

Here is a further pie chart I've made of all the different cuisines in Brighton, this time using Adobe Illustrator. 


I also made a condensed pie chart showing just the cuisines with the largest percentage of restaurants in Brighton...


Friday

Venngage data visualisation

I've recently discovered this site called Venngage that lets you create your own data visualisations and graphs, either by using an already made template or by starting completely from scratch and making your own thing.
I decided to use my Brighton restaurant data from Tripadvisor and made a page of data visualisations from scratch. 
I'm not able to embed the html of the page in this post but you can access it HERE.

I've included a screen grab of the graph so you can see what it looks like but without the interactive part which is quite important to the understanding of the data.


The pie chart is interactive; when you hover over each coloured slice it tells you what type of cuisine it is representing and how many restaurants of that cuisine there are in Brighton.

UPDATE: unfortunately I discovered when recently testing out the link that Venggage has made some changes to my infographic and the pie chart no longer gives you the names of the different cuisines when you hover over each section. Instead I've added in a box underneath the pie chart to explain the colour coding, and when you hover over each different cuisine type in the box it should light up the section for that cuisine in the pie chart, making it easier for you to see which slice refers to which cuisine.


The '£' bubbles represent the different price brackets in relation to Brighton restaurants, and what percentage of restaurants fall under each price bracket. So, for example, most restaurants in Brighton are moderately cheap (represented by '££') and very expensive restaurants come in second (represented by '££££').


At the bottom of the page I've made a wordcloud consisting of the most popular dining options available for Brighton restaurants.
Please click on the link, or the first image, to be taken to the real graph so you can get a proper feel of it.


Tuesday

Most visited restaurants in Brighton and their ratings

Here is a map I made of the most visited restaurants in Brighton according to Tripadvisor (as of February 2014).
If you click on each restaurant marker you will be given the restaurant name, address, the number of Tripadvisor visitors and the restaurant's rating on TripAavisor, as well as a photo of the place.


Thursday

Heatmap of Tripadvisor's most visited restaurants in Brighton

I made a heatmap on Google Fusion Maps to go along with my standard map of the most visited restaurants in Brighton.
The redder a marker is the more visits it has had.


Lots of websites seem to be using heatmaps nowadays, such as Zoopla  for property prices...


And Yelp for finding things such as 'hipster density'(!) and 'cocktails' in a given city...


Wednesday

Stefanie Posavec

I was trying to find more data I could take from Tripadvisor, as there's only a limited amount of data that's immediately available, such as the number of restaurants of each cuisine and the number of restaurants in each price bracket.
I wanted to try and work out the hierarchy of rankings of each different cuisine in Brighton, but the only way to do that was to go through the incredibly long process of noting down the ranking of every restaurant in each category of cuisine (such as #1, 6, 9 etc...)
I did this for all of the restaurants that came under the category British cuisine, and ended up with a very long list of numbers that didn't really mean anything, realising that it would take way too long to do the same for each of the different cuisine types in Brighton...


1, 3, 4, 6, 7, 25, 29, 32, 37, 42, 51, 52, 54, 57, 60, 65, 67, 77, 84, 90, 91, 96, 97, 98, 100, 102, 104, 105, 108, 110, 111, 113, 115, 116, 118, 119, 128, 133, 137, 140, 105, 108, 110, 111, 113, 115, 116, 118, 119, 128, 133, 137, 140, 142, 146, 148, 149, 150, 153, 154, 156, 158, 160, 163, 165, 169, 173, 175, 178, 201, 204, 209, 211, 214, 218, 219, 220, 222, 232, 233, 234, 235, 238, 243, 245, 246, 247, 254, 261, 264, 272, 281, 286, 289, 290, 291, 292, 293, 296, 301, 304, 307, 311, 316, 317, 318, 322, 326, 337, 343, 344, 347, 350, 351, 354, 356, 362, 370, 374, 377, 378, 382, 388, 389, 391, 392, 396, 399, 400, 402, 404, 407, 409, 412, 414, 415, 420, 423, 427, 428, 431, 433, 435, 436, 453, 459, 460, 461, 465, 475, 476, 478, 480, 484, 488, 492, 494, 498, 503, 508, 511, 512, 516, 518, 523, 524, 525, 526, 530, 533, 538, 548, 556, 558, 559, 565, 566, 570, 572, 578, 584, 585, 586, 587, 592, 593, 596, 604, 612, 617, 623


When I showed this long sequence of numbers to my tutor Andrew he thought it was actually interesting and worth including in my project.

I thought this was kind of relatable to the work of artist/data visualiser Stefanie Posavec, who does these amazing hand written data visualisations that are basically a load of data - letters/words and numbers - arranged in such a way as to create what can be seen as a piece of art.
She simply uses a set of highlighters and a ballpoint pen, colour coding data to create patterns and innovative data visualisations...


She's made a data visualisation of Jack Kerouac's On The Road, dividing the book up into chapters, paragraphs and sentences.


When you look at the overall image you can't tell that it's made up of words and data, or that it's handwritten and not digitally generated.


Tuesday

No. of restaurant Twitter mentions in the last 30 days

I made these charts using Infogr.am
The data was obtained from Topsy.com, and I recorded the number of mentions each of the most visited restaurants (according to Tripadvisor) got in the last 30 day (from 28/01/14).


Saturday

Sentiment scores from Twitter mentions

This bar chart I made shows Topsy.com sentiment scores, meaning the score each restaurant has been given based on the amount of sentiment shown in Twitter mentions.
I chose to display a cross section of restaurants which showed the largest difference in scoring.


Thursday

Foursquare user ratings and popularity

I've made another map using Google Fusion Tables, this time to show restaurant data from location-based social networking site Foursquare.
It's interesting to compare data from Foursquare with that of Tripadvisor as both of the sites give user ratings/rankings. On Foursquare users rate the restaurant in question with a score out of 10, whereas on Tripadvisor users provide a score out of 5, and Tripadvisor uses this data to rank the restaurants in order of best to worst. Restaurants inevitably are attributed with different ratings from each site, perhaps giving an indication of how preferences and tastes differ between people that use Foursquare and people who use Tripadvisor.
In the map below I have included the Foursquare user rating for each restaurant, as well as the number of Foursquare visitors and the number of check-ins. I've also included the cuisine type for each restaurant.


Some restaurants, often the less visited ones, don't have user ratings on Foursquare so I left the section blank for them.


Monday

Restaurants with the highest number of check-ins on Foursquare

I made this bar chart on Adobe Illustrator to show the top restaurants with the highest number of check-ins on location-based social media site Foursquare.


Thursday


Mapping Users' Journeys

As well as being interested in Brighton cuisine and the data you can gather about it, I'm also interested in the idea of the communities that surround reviewing websites.
One thing I find particularly interesting is how, on Tripadvisor for example, you can see all the information about reviewers if you click to be taken to their full profile. This information includes things such as their name, any photos they've put up, whether they have any mutual friends with you on Facebook (if you're logged in) as well as all of the different places they've reviewed.
This seems a little stalkerish to me as it allows you to literally map someones journey around the world/the country, and their reviews often contain personal bits of information about the person and their friends.
I thought it would be interesting to pick a reviewer on Tripadvisor and map out the journey they have travelled using their reviews. I chose a particularly active Tripadvisor user so that there'd be a lot to map.


Maps on their profile page show all of the different places they've visited and reviewed in the world...


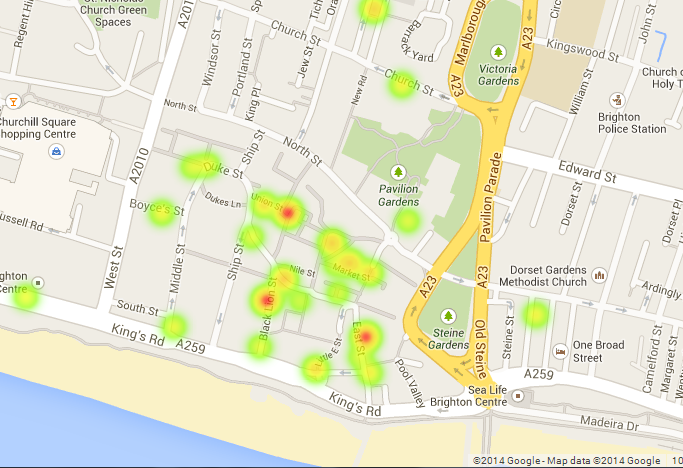
Using a site called 'Free Map Tools' I made my own map showing all of the locations in London that this user reviewed on Tripadvisor.
I've connected them all in order of the dates visited.
Unfortunately there was no way to embed the map so instead I've taken screenshots of it...


As you can see it's quite a fiddly, back and forth journey! The user has visited and reviewed quite a few different places in London, some more than once.


The starting point was The Cinnamon Club, which was actually visited twice, once in January of 2012 and then again in July 2013.


The ending point of this user's travels in London is at the Caxton Grill, the middle point on the map below.


Apparently the total distance travelled is 25.663 miles.


The mapping tool also estimates travel times based on the distance traveled and the method of transportation.
I wanted to see how long it would take to walk/jog the distance compared to driving...


I also mapped all of the places visited in London on a map using Google Fusion Tables.
Information I included for each point is the address, date visited and user rating; this will come up when a point is clicked on for more information.
I have now also added the user's reviews of each place as well; some of them are quite amusing and insightful into the user's life, giving away lots of personal details.
I find it pretty creepy that I'm able to do all of this for a user! I wonder if reviewers on Tripadvisor are fully aware that all of this information about them is available for anyone to see.

Tuesday

Mapping Users' Journeys Contd.

I've also mapped the same user's journey around the world, this time mapping all of the places she has visited and reviewed, rather than just the places in London.
She's travelled around quite a bit, mainly in Europe but also having been to Orlando, Florida once.
Apparently the total distance travelled adds up to 14251.187 miles, although according to Tripadvisor it's only 5,630... either way, that seems like a lot of miles!


I also made a map of all of these places visited on Google Fusion Tables. If you click on each marker it will tell you the name of the place and the number of times visited by the user.


From this I also created a heatmap to show the locations that the user has visited the most...